Tanium Endpoint Management: What a Unified Platform Actually Looks Like

We covered how Tanium delivers speed and scale in a previous post. The architecture is the foundation. This blog is about what you build on it. 

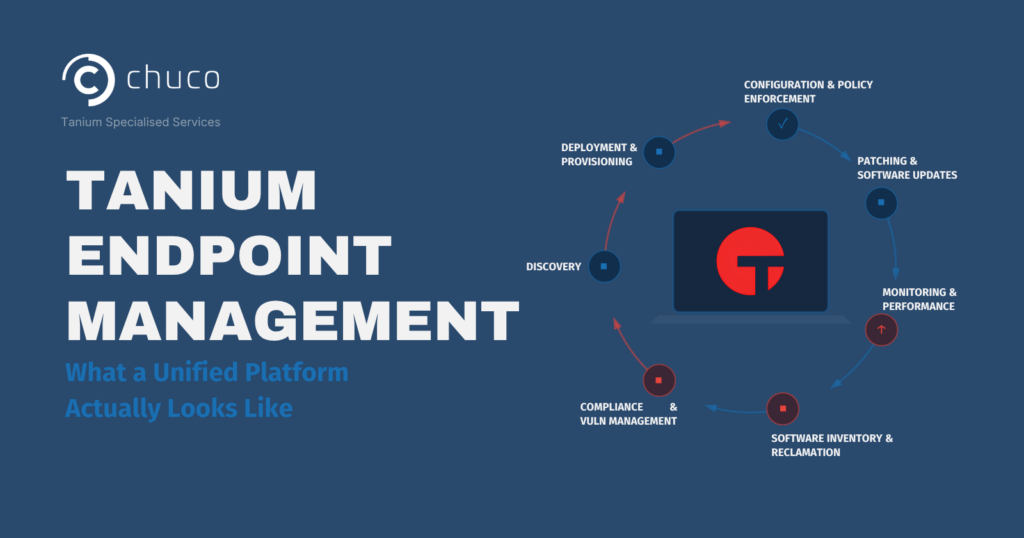
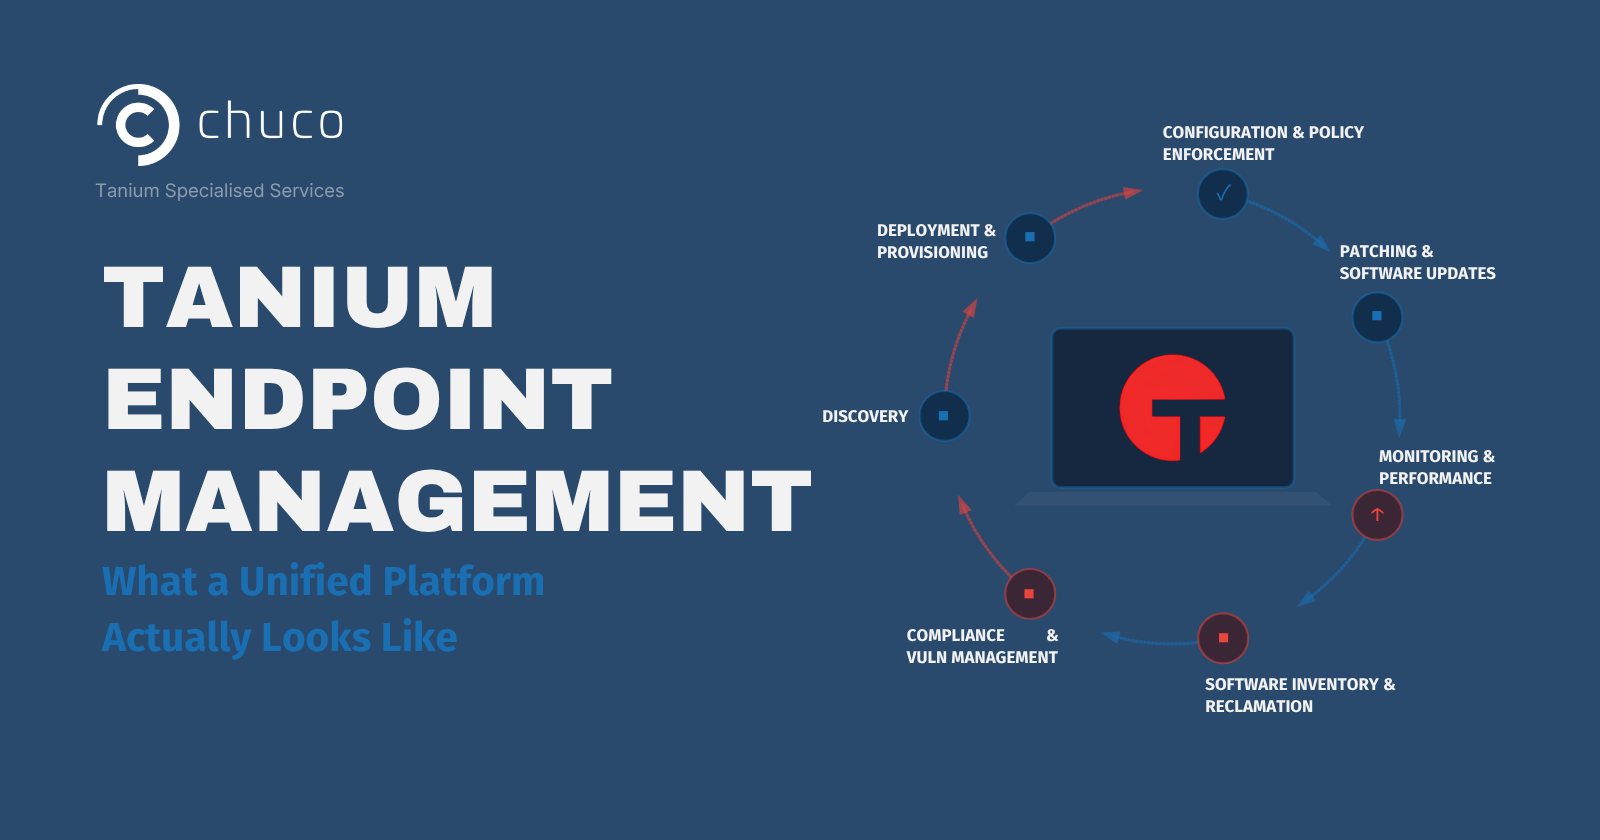
Tanium endpoint management covers the full endpoint lifecycle, from the moment a device appears on your network to the day it gets decommissioned. Most organizations piece this together with separate tools for discovery, patching, compliance, performance monitoring, and inventory. Each one generates its own data, requires its own maintenance, and gives you its own version of the truth. Tanium replaces that patchwork with a single platform. 

Here’s what that looks like, stage by stage. 

Discovery: Knowing What You Have

You can’t manage what you don’t know exists. Tanium Discover identifies managed and unmanaged devices across your network in real-time. Not a scheduled scan that runs overnight and gives you yesterday’s picture. A live view of what’s actually connected right now. 

This is where most Tanium endpoint management engagements start, because the gap between what teams think they have and what’s actually on the network is almost always larger than expected. Devices that were supposed to be decommissioned.  Test machines that never got the agent installed. Discover finds all of it. 

Tanium Asset takes that inventory deeper. Hardware specs, installed software, license usage, warranty status. For Asset and other Tanium modules beyond Discover, this data comes from Tanium-managed devices with the Tanium Client installed. That gives you a live CMDB that doesn’t require manual reconciliation because the data comes directly from the endpoints themselves. 

Deployment and Provisioning: Getting Endpoints Ready

Once you know what you have, the next stage is getting endpoints into a known-good state. Tanium Provision handles OS imaging and provisioning, deploying standardized configurations across bare-metal or virtual machines. 

For organizations rolling out new hardware, onboarding acquisitions, or migrating operating systems, provisioning through Tanium means every endpoint starts from a consistent baseline. No more golden images that drifted three months ago without anyone noticing. The image and the endpoint it produces are both visible in the same console. 

Configuration and Policy Enforcement: Keeping Endpoints in Line

Getting endpoints into a good state is one thing. Keeping them there is another. 

Tanium Enforce ensures that security policies and configurations stay applied. Firewall rules, registry settings, browser configurations, encryption policies. When an endpoint drifts out of compliance, Enforce brings it back automatically without waiting for the next scan cycle or a manual remediation ticket. 

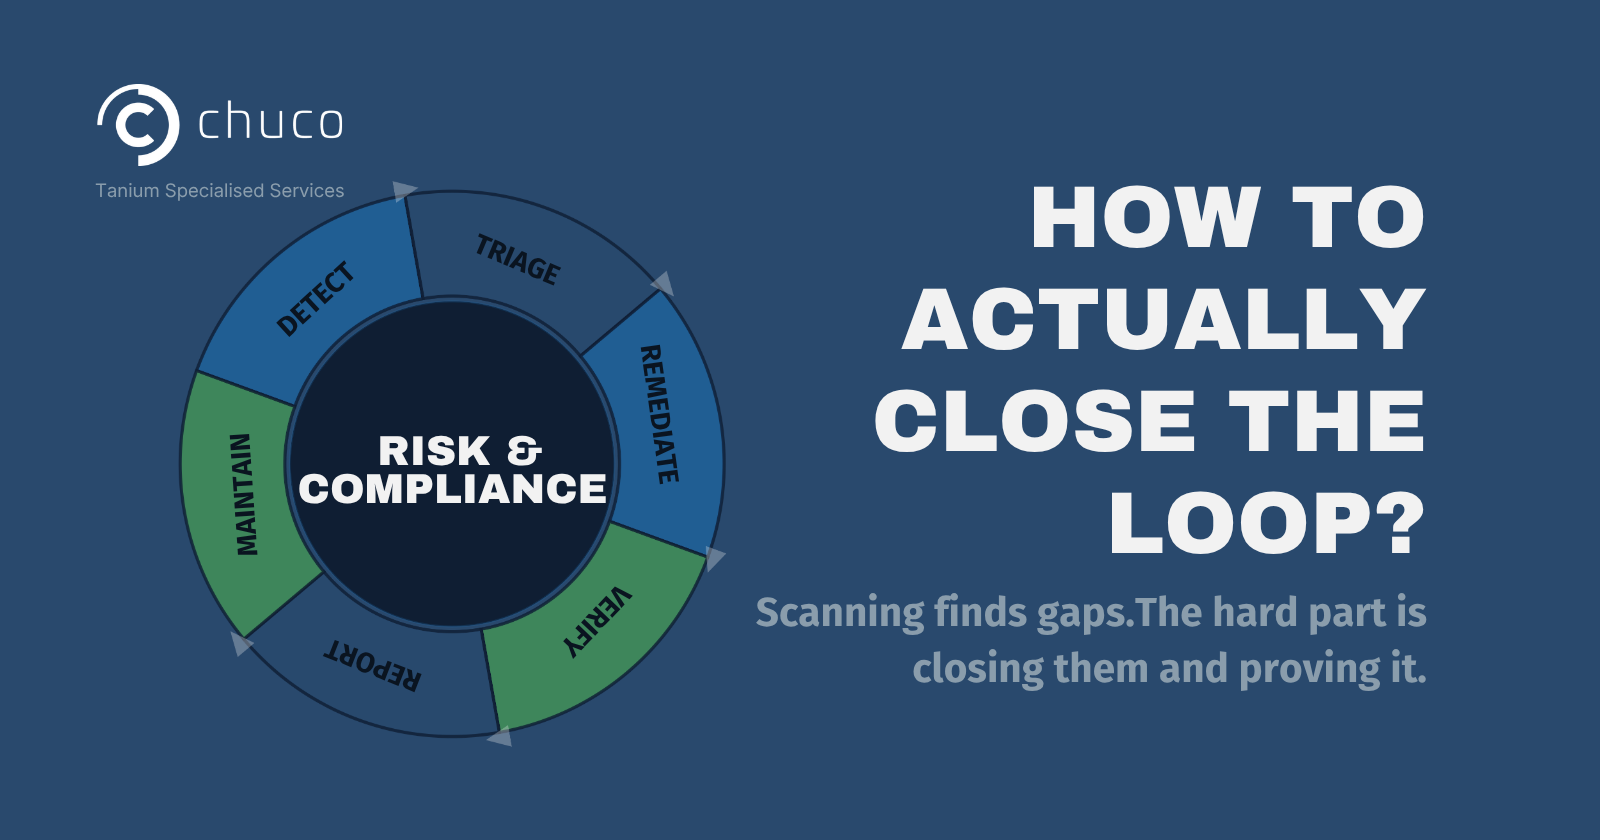
This is the module most often underutilized in Tanium endpoint management environments. Teams deploy Comply to scan for gaps but don’t pair it with Enforce to close them. The result is a detection loop without a remediation loop: same findings, every scan, because nothing is maintaining the desired state. 

Patching and Software Updates: Staying Current

Tanium Patch handles OS updates across Windows workstations, Windows servers, and Linux. Tanium Deploy handles third-party applications. 

Together, they form the core of operational Tanium endpoint management. But “patching” at scale is a deceptively complex operation. Maintenance windows, dependent server ordering, pre-patch validation, post-patch verification, exception handling, and compliance reporting all need to work together consistently. 

The difference between “we patch” and “our patching works” is operational discipline. The tools handle the mechanics. Someone needs to handle the orchestration. We covered this in depth in our managed services for Tanium patching post. 

Monitoring and Performance: Catching Problems Early

Tanium Performance monitors CPU utilization, disk latency, memory pressure, application crashes, and system health across the fleet. You can also enable alerts to notify your team when something falls outside expected thresholds and needs a closer look. When something degrades, the data is already in the same platform your team uses for

Everything else. No context-switching to a separate monitoring tool. No correlating timestamps across different dashboards. 

For Tanium endpoint management, this is the module that turns the platform from a management tool into an observability tool. Teams can define alert thresholds, investigate patterns across endpoint groups, and access historical data for root cause analysis, all within the Tanium Console. 

Software Inventory and Reclamation: Cutting Waste

Tanium Asset also tracks software usage across the fleet. Licenses that are installed but unused, applications that were deployed but never opened, subscriptions running on machines that no longer need them. This data feeds directly into license reclamation workflows.

Tanium Asset can also help identify Anomalous Software. You can define which software is approved and report on applications that are installed but shouldn’t be present, giving IT and security teams a way to spot unauthorized or unexpected software across the environment.

For CFOs and procurement teams, this is where Tanium endpoint management delivers direct cost savings. Every unused license identified and reclaimed is budget recovered without cutting capability.

Why the Full Lifecycle Matters

Individual point tools solve individual problems. A patching tool patches. A monitoring tool monitors. A compliance scanner scans. 

Tanium’s value in endpoint management is that all of these capabilities share the same agent, the same data, and the same console. A compliance finding can trigger a patch. A patch can trigger a verification scan. A performance degradation can trigger an investigation that traces back to a recent deployment. The workflows connect because the platform is unified. 

That’s the theory. In practice, getting all of these modules configured, maintained, and working together requires dedicated bandwidth and Tanium-specific depth that most teams are spending on other priorities. That’s where Chuco comes in. 

As a Tanium specialist, Chuco helps organizations deploy, configure, and operate the full Tanium endpoint management lifecycle. Whether that means running it for you, running it alongside you, or simply being the expert team you call when something needs attention. 

Getting Started

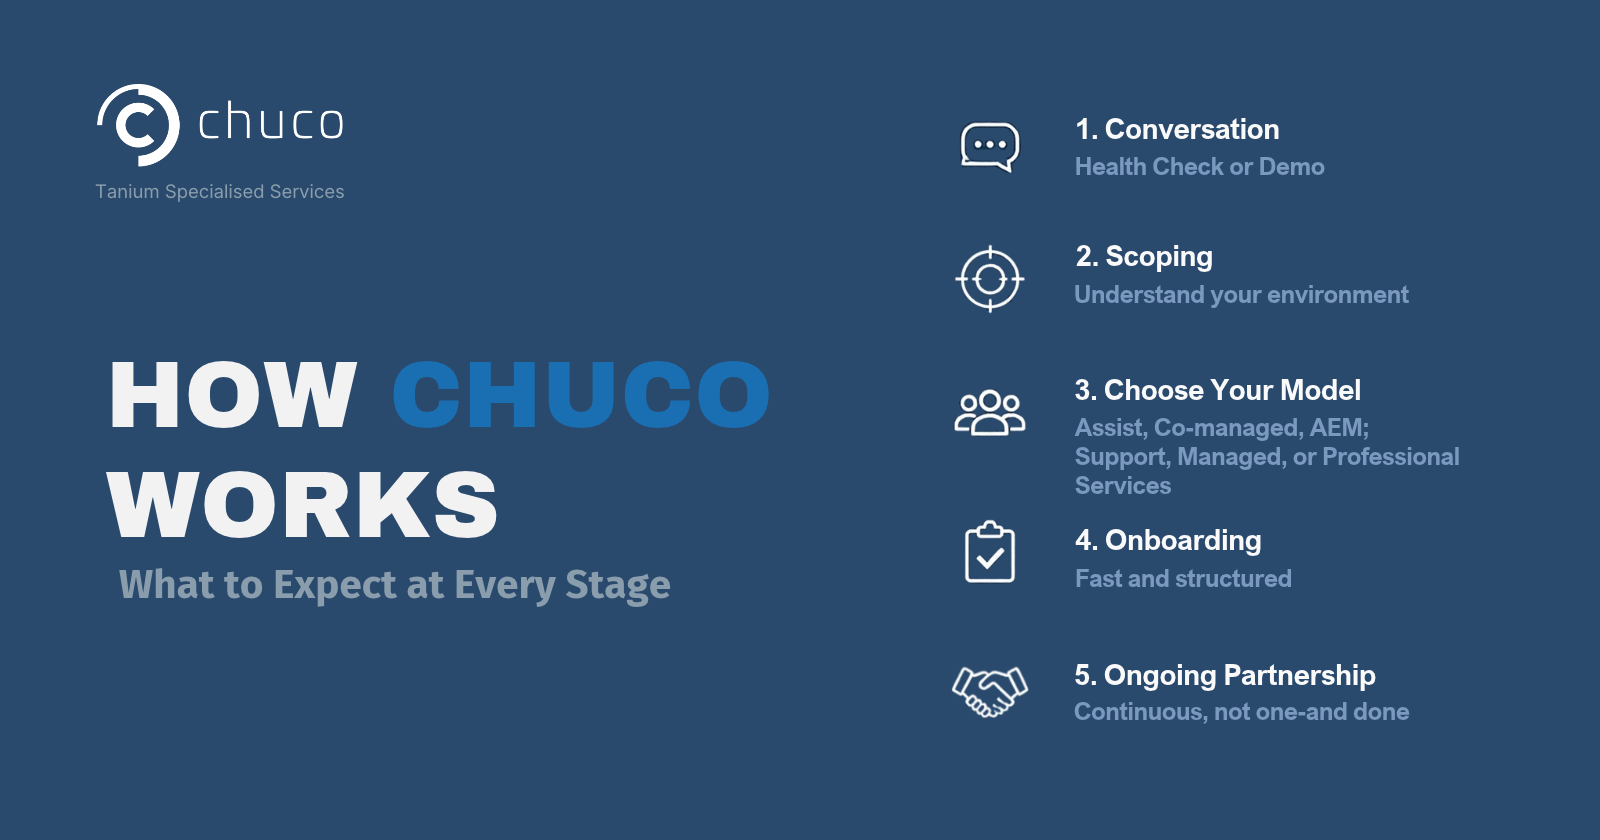
Already using Tanium? Schedule a Health Check to see how well your environment leverages the full platform. 45 minutes with our team, no commitment. 

Explore our Services hub for support, managed services, and professional services. 

Evaluating Tanium? Request a demo and see the platform in action. Visit our Licensing hub to explore Chuco Assist, Co-Manage, and Managed AEM. 

Stay Ahead with the Tanium Insider Newsletter!

Other Resources that might interest you ​