Real-Time Endpoint Management: How Tanium Delivers Speed and Scale

A Tanium health check isn’t an audit and it isn’t a critique of your team. It’s a focused review of how your Tanium environment is actually performing against what it’s capable of delivering. The gap between those two things is almost always larger than expected, and it’s almost never because the team lacks skill. It’s because bandwidth, competing priorities, and the depth of the platform make it difficult to stay on top of everything Tanium can do.

We run health checks across environments of every size, and the same patterns show up consistently. Here are the five signs that tell us a Tanium health check is overdue.

How Tanium's Linear Chain Architecture Enables Real-Time Endpoint Management

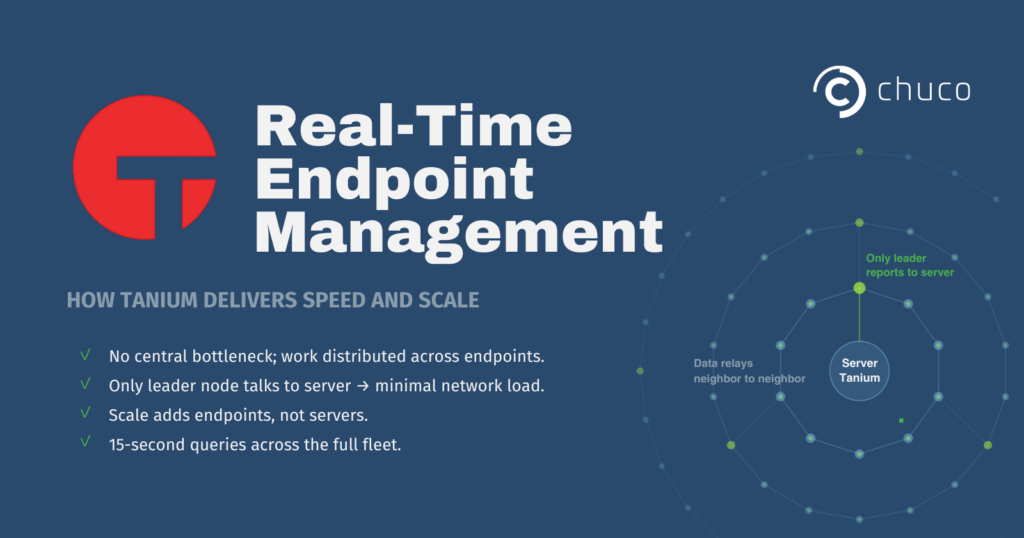
The foundation behind Tanium’s speed and scale is the linear chain architecture. Most endpoint tools use a hub-and-spoke model where every endpoint reports back to a central server. That works at small scale, but as endpoint counts grow, the central server becomes a bottleneck. Network overhead increases. Query times slow. At a certain point, organizations start sampling rather than scanning every endpoint, which means trading completeness for speed.

Tanium’s linear chain eliminates the bottleneck entirely. Instead of every endpoint communicating with a central server, endpoints pass information to their IP neighbors in a chain. The data aggregates as it moves through the chain and arrives back at the Tanium Console as a complete answer. The result is a platform that doesn’t just tolerate scale. It thrives on it.

The numbers tell the story:

  • 15-second query response across the full fleet. Not a sample. Not a subset. Every endpoint, answering every question, in seconds. Whether you’re managing 10,000 endpoints or millions, the response time stays consistent because the architecture distributes the work across the endpoints themselves rather than concentrating it on a central server.
  • Zero sampling. Every query touches every endpoint. When you ask Tanium “how many endpoints are running an outdated version of Chrome,” the answer accounts for 100% of your fleet. No extrapolation. No statistical modeling. Complete data.
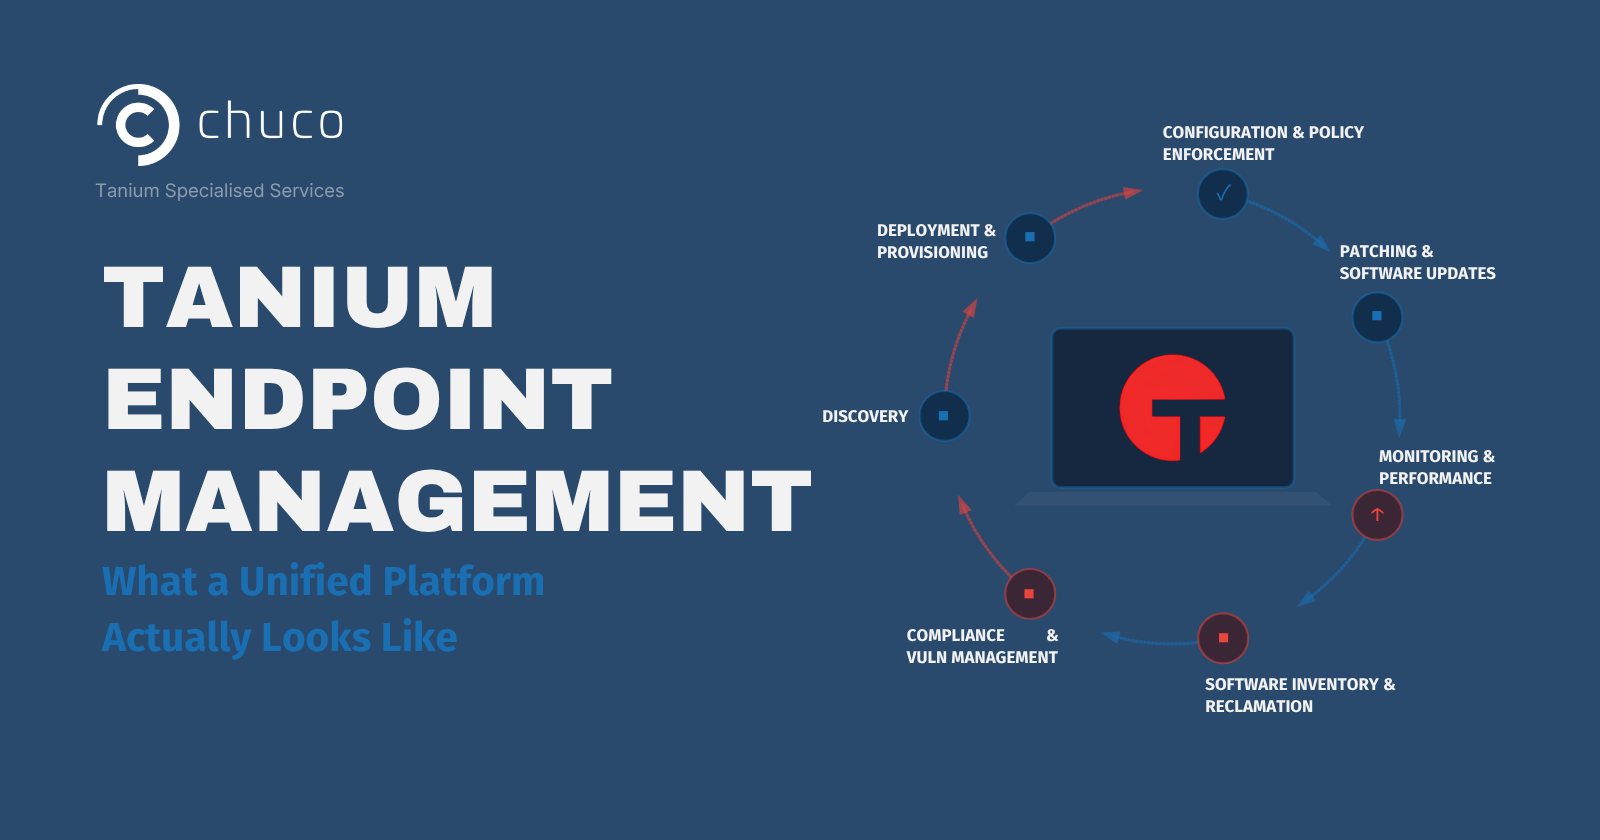
  • One agent. A single, lightweight Tanium Agent per endpoint handles everything: patching, vulnerability scanning, compliance enforcement, software deployment, performance monitoring, and threat response. In environments running legacy tool stacks, it’s common to see three to seven separate agents on every endpoint. Each one consumes resources, requires maintenance, and generates its own version of the truth. Tanium consolidates that into one.
  • 6x faster remediation. Speed isn’t just about queries. It’s about the ability to act on what you find in the same motion. Tanium can identify an issue, scope its impact across the full environment, and deploy a fix in a single workflow. That closed loop between visibility and action is what turns real-time endpoint management from a marketing phrase into an operational advantage.

What Real-Time Endpoint Management Means for Daily Operations

Speed and scale at the architecture level translate into specific operational capabilities that change how teams work day to day.

Patching at scale with real-time validation. Tanium Patch handles OS updates across Windows workstations, Windows servers, and Linux. Tanium Deploy handles third-party applications. Because the platform can query the full fleet in seconds, post-patch validation happens in real-time rather than waiting for the next scan cycle. You know immediately whether a patch took, across every affected endpoint.

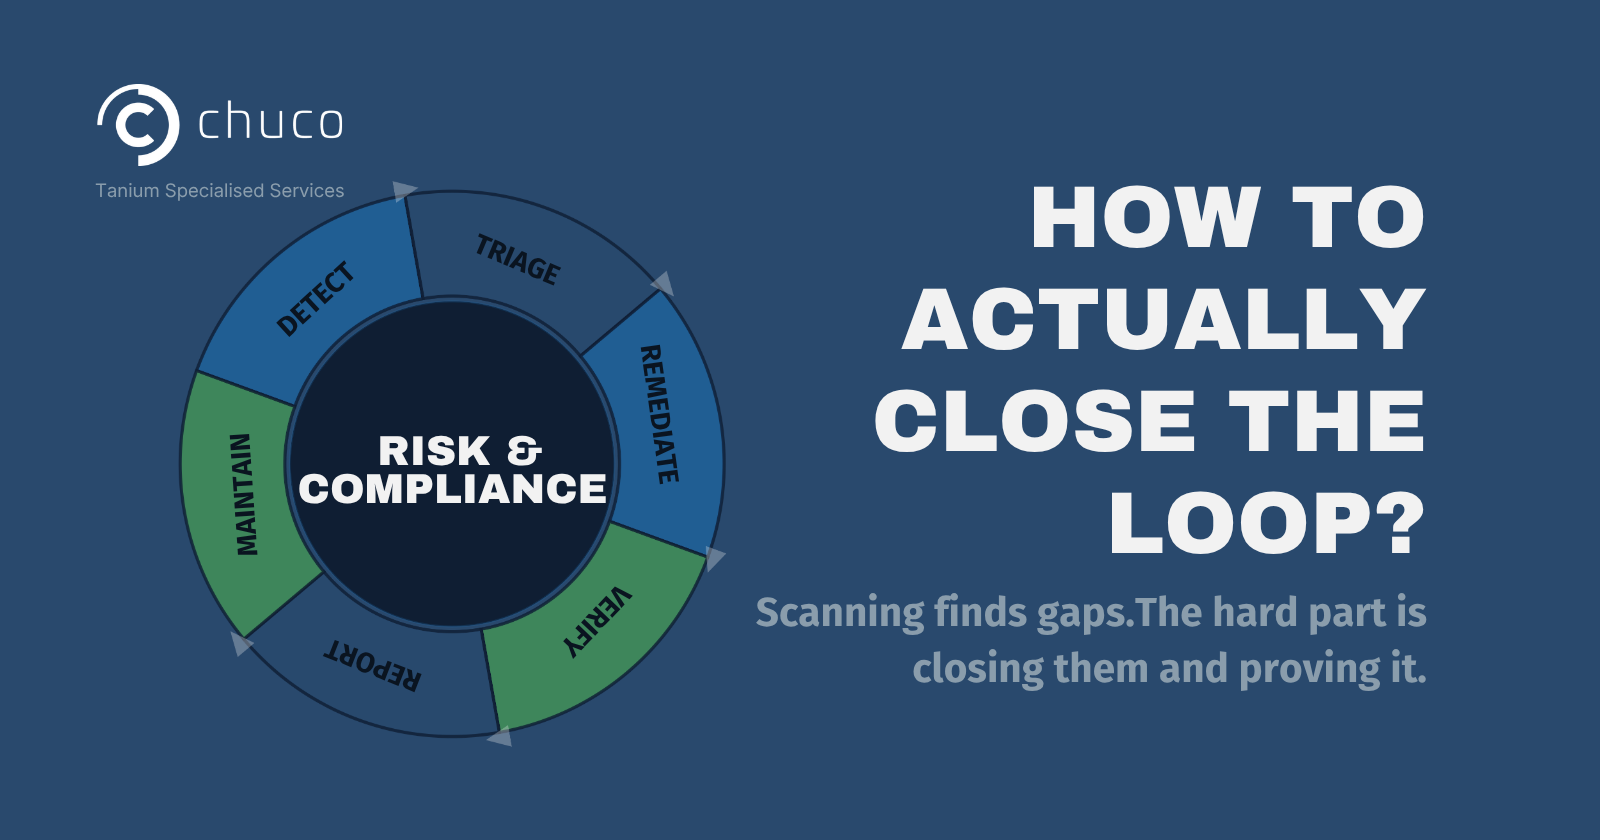
Vulnerability scanning without trade-offs. Tanium Comply scans for configuration compliance gaps and known vulnerabilities in real-time. No stale scan results sitting in a queue. No sampling. When a critical CVE drops, you can assess your exposure across the entire environment in seconds and feed remediation directly into your patch workflows. Paired with Tanium Enforce, the detection-to-enforcement loop closes automatically.

Endpoint performance visibility. Tanium Performance extends the platform to monitor critical performance metrics: CPU utilization, disk latency, application crashes, and system health. IT teams can define alert conditions, visualize problems and their commonalities across the environment, and access historical data from endpoints for root cause analysis. When performance issues surface, remediation happens through the same platform rather than requiring a separate tool.

Incident response at speed. When a security incident occurs, the first question is always “what’s the blast radius?” With real-time endpoint management, the answer comes in seconds, not hours. Tanium Threat Response can identify affected endpoints, isolate them, and deploy containment measures in a single workflow. The difference between responding in seconds and responding in hours is often the difference between a contained incident and a breach.

Asset visibility without guesswork. Tanium Discover and Tanium Asset provide live inventory of every managed and unmanaged device in the environment. No relying on CMDB data that was accurate three months ago. When someone asks “how many endpoints do we have, and what’s running on them,” the answer is current, complete, and verifiable.

Why Speed and Scale Still Require Operational Depth?

The architecture delivers the capability. But getting consistent, measurable outcomes from that capability requires operational depth that goes beyond the initial deployment.

Tanium is not a set-and-forget platform. Modules need configuration tuned to your specific environment. Patching workflows need to account for maintenance windows, dependent server ordering, and exception handling. Vulnerability triage needs to separate critical exposure from background noise based on your actual risk profile. Reporting needs to reach three different audiences at three different levels of detail.

The teams we work with have the skills to run Tanium well. What they don’t always have is the dedicated bandwidth and Tanium-specific depth to stay on top of everything the platform offers while managing every other IT and security priority on their plate. That’s the gap Chuco fills.

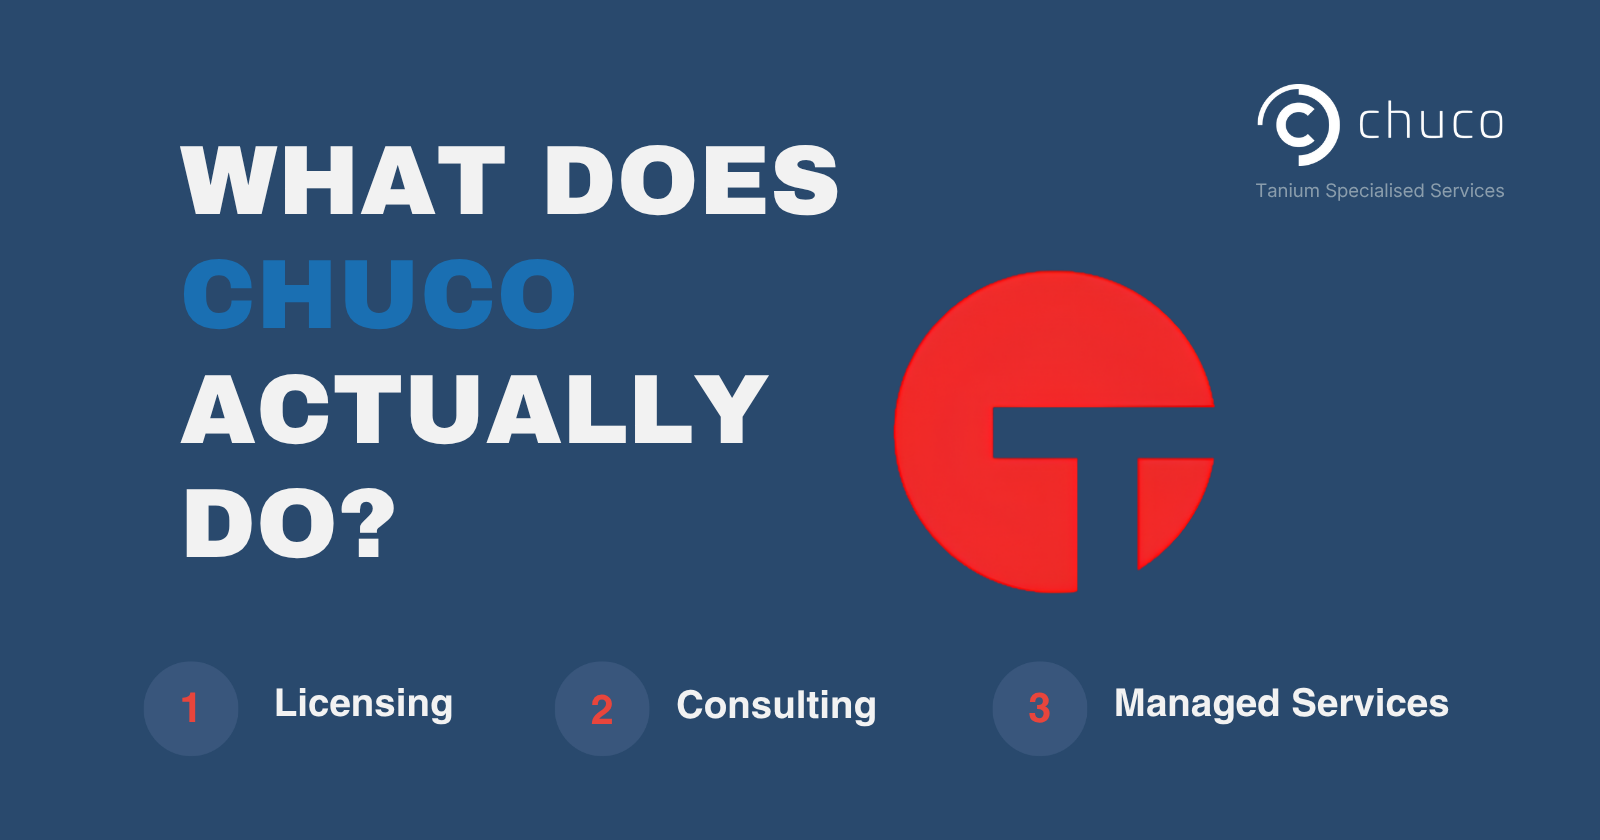
As a Tanium specialist, Chuco provides managed services, support, and professional services that help organizations turn the speed and scale of the platform into consistent operational results. Whether that means running your patching operations, managing vulnerability remediation, building custom reporting through the Tanium API, or simply being the dedicated Tanium expertise your team can call on when they need it.

Getting Started

Already using Tanium? If you want to see how well your environment is leveraging the platform’s full capabilities, schedule a Tanium Health Check. It takes about 45 minutes with our team and gives you a prioritized picture of where things stand.

Explore our Services hub to learn about support, managed services, and professional services engagements.


Evaluating Tanium for the first time? Request a demo and see real-time endpoint management in action. Visit our Licensing hub to explore Chuco Assist, Co-Manage, and Managed AEM options.

Stay Ahead with the Tanium Insider Newsletter!

Other Resources that might interest you ​